I have been doing project management for seventeen years already. I have carried out software development projects for a bank, for civil engineers and for document management.
I have applied practices of
Rational Unified Process (RUP)
Earned Value Method
PMBoK
CMMI
Agile Project Management (based on Scrum )
Although I was always trying to apply correctly the methods, identify and address risks properly, communicate with the team on a daily basis (this has never been a problem in our projects), communicate with the customer often, I have suffered the problems of (more…)
I started working as software development project manager in 1996. We were a team of 5 people, young and motivated, developing a facility management system for a bank.
Just to give you an idea of that time, we had internet access on one computer only, so we were checking the team’s email (not the individual ones) twice o three times a day. The mobile phones were like the one you see on the picture bellow, i.e. no sms, no WhatsApp, nothing of this type.
That was the only project we were working on, i.e. there was no resource sharing among projects and no influence from other development undertakings.
“If you do not actively attack risks, they will actively attack you” – Tom Gilb
What I usually see in the risk tables of project or service plans are “deliver late”, “surpass the budget”, or “does not pass customer acceptance due to unclear requirements”.
At the same time, teams most often complain from not being able to meet deadlines, and surpassing budget.
Obviously we are rather attacked than attacking risks.
Why analyse defect data?
What can we do to protect better the projects and the services from the risks?
Logically, understanding better the causes and the circumstances for the problems should help.
Have you checked what part of the total delivery time (lead time) is effective development, rework due to defects, or waiting for some input? In other words do you know the efficiency of your process?
When estimating the delivery time, did you include the time for rework and waiting?
My experience shows that few companies systematically analyse their defects and blockers with the aim to understand their root causes and act on them. Blockers are sort of defects in some of the processes involved in carrying out the work, e.g. managing suppliers, scheduling, handling customer information, etc.
Several times I have seen surprise on the faces when people realize that resolving blockers and fixing defects takes them more than 30% of the total estimated effort, prolongs project duration with more than 20%, and affects significantly customer satisfaction.
If you want that your work be fit for purpose, you should listen to your defect data (including blockers) and act adequately.
How to analyse defect data?
Analyse defect data is not so difficult – there are several techniques that help with this. The main reason for not taking advantage from this valuable source of information is that the majority of the companies still do not collect data about defects and/or do not know what this data say.
A simple practice that you can use to learn from your defect data is to follow these steps:
Classify the defects based on criteria that emerge from telling the story of each defect. For instance, we started working without getting commitment from the customer about the functionality, dependencies with another system were not taken into account, the person involved was new and with insufficient domain knowledge, etc.
Analyse the causes and look for patterns. Although each story has its individual aspects, problems share great part of the roots.
Focus on the lead time and efficiency of resolving the defect or blocker
Decide how to address the causes as to prevent them from occurring.
What do defects have to do with risks?
Most of the problems are recurring at least until we manage to preclude them completely.
This means that we have to be prepared to see our experience again in the future. The point here is how we can identify the risk well in advance and effectively avoid it.
Mirroring the past through the “now” point is a simple and helpful technique. The problem from the past becomes a risk in the future. The causes from the past convert to risk symptoms that we have to carefully watch for.
Which is the right place to discuss risks?
Lots of teams try to mitigate their risks individually and independently on the others. This is not very effective especially when there are dependencies between the services.
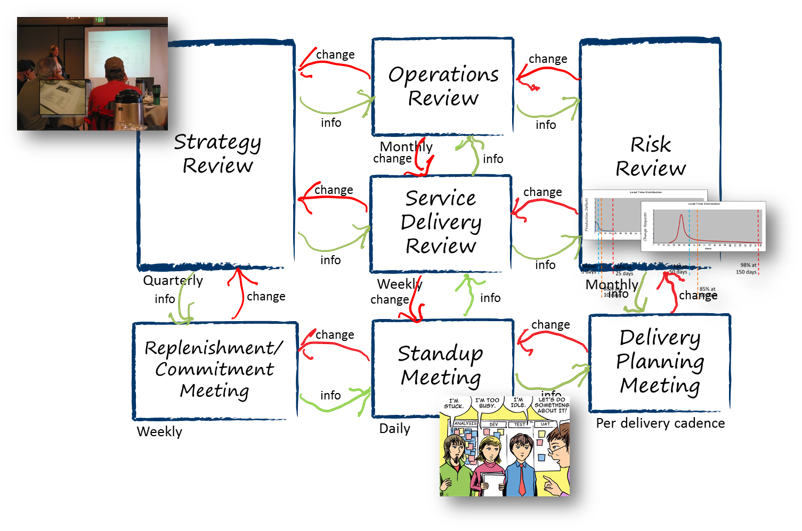
I assume you conduct some periodic meetings at which you review your projects and services. If you use the Kanban routines (cadences), the ideal place is the Risk Review meeting.
Image copied with permission from David J Anderson’s post “Kanban cadences”.
Make sure that you have a good understanding of the entire context to be able to make pragmatic decisions about how to hedge risks.
Summary
At team level not understanding the causes for the defects and blockers makes you vulnerable to project and service risks
At organization level not addressing properly the risks reduces your fitness for your business purpose.
Applying a pragmatic approach to defect analysis, understood and shared by all stakeholders, facilitates risk hedging.
In 1992 Bill Clinton chose an interesting slogan for his political campaign:
Of course, there were many other important topics for the country and a lot of factors that were influencing their resolution. However, Bill Clinton’s key message was focused on the core driver for the country, the economy.
I frequently meet companies that struggle with the need to reduce delivery time for their projects and services, provide more competitive prices, and adapt better to changing customer needs.
It is difficult to introduce drastic changes in organizations where hierarchical structures and responsibilities have been settled for long years and any disruption scares people and makes them resist. For such organizations, the need of change is definitely recognized. How to approach it, however, is not yet completely clearly. (more…)
This month I had an interesting service for the IT department of a bank. I say ‘interesting‘ because they asked me to visit them, see how they were carrying out and managing their projects and tell them how I found it. Nothing about particular problems they want to resolve, objectives they are pursuing, or a method that is interesting form them. Just come – see – and give us your opinion.
I went with a good dose of curiosity and with some anxiety because I did not know what to expect.
The context
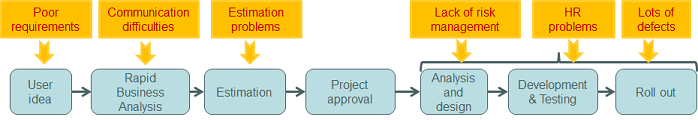
To understand the context I asked both the software development team and the business users (the customer) to describe their workflow as well as any difficulties they had in their daily work (a problem per post-it).
A summary of the current situation can be drawn as follows:
The painsthat need urgent treatment according to the prioritization of both teams are:
Poor user requirements (defined at the level of idea)
Insufficient business analysis
Task estimation problems – users do not understand why developers need so much time to the work, there is pressure to reduce the estimates, and then the problems of not meeting the dates appear
Frequent priorities changes
High workload and inability by the development team to respond quickly to user requests.
Lack of risk management
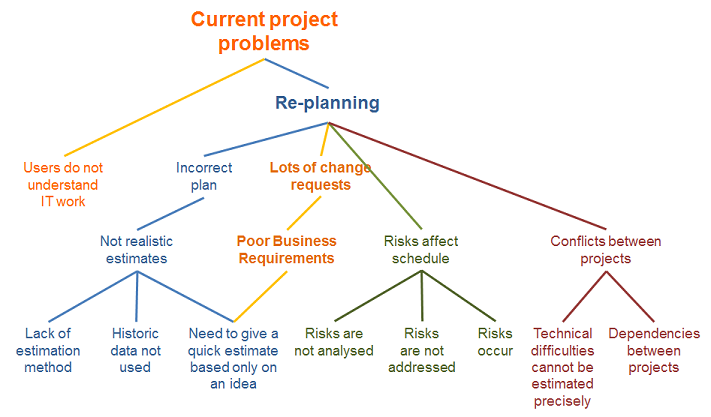
The analysis of the problems can be summarized like this, reading the tree bottom – up.
“Quick wins” are needed.
What vitamins should I prescribe them that will bring them
noticeable improvements in a short time?
Defining an estimation method would help, also establishing criteria and policies for managing requirement changes and risks, but all this will take time and effort. In addition, they have to be accepted well by the people, both the users and the developers.
Listening to the pains and fears of both sides the following image appeared in my mind:
What lays at the bottom of the problems is the matching between the user requirements, in the business people language, and the development team work, with all its creative and technical aspects.
Communication and shared visibility in the work are
vitamins the ICT companies.
No technology or formal method will give positive results in short time, if the communication between people fails and there is a lack of visibility in the work that is carried out.
I confirmed this idea with the team and all together we came to the following two elements of the “quick win” solution:
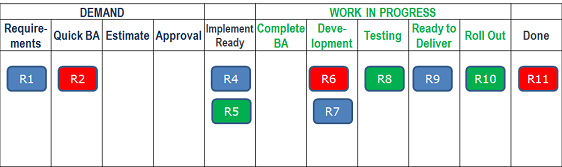
Work in multidisciplinary teams
Use a shared kanban board to visualize the work in progress and facilitate its understanding and management.
Now back to the pains that need urgent resolution. All of them will be positively affected by this simple solution, won’t they?
At least the team and I are convinced so.
What is your opinion?
If you think this experience can help a friend of yours, forward her the message. She will pay you back the favor at another important to you moment.
How many from your recent projects or services did you deliver on time? Of course, complete and without the need to work overtime or on weekends.
Four years ago I started collecting photos of the problems that software development organizations face, regardless of the working method they use. Last year I started expanding my collection with photos from industrial companies.
Do you know which the most recurrent pain is? (more…)
Throughput is relatively less known measure for traditional project management companies (based on PMBoK, Prince2, CMMI). However, I believe it will be gaining more respect in the near future with the spreading of the Lean concepts.
Throughput is the amount of work items delivered in a given period of time (e.g. week, month, quarter).
When we say delivered we really mean completed and possibly delivered to the customer. I.e. money is collected at the end of the process.
To understand the throughput concept, let us assume that during the last five weeks a team has delivered respectively 4, 6, 4, 2, and 3 stories per week. If there are started, but not finished stories, they do not take part of the calculations.
The average throughput for these five weeks is (4+6+4+2+3)/5 = 4 stories/week (rounded).The standard deviation is rounded to 1 story/week.
Throughput is based on real data of team’s capability to deliver. Throughput variability reflects the impact of factors such as story size, complexity, urgency, and person’s skills.
Throughput can be used for planning purposes. For instance continuing the above example, the team can estimate that their throughput (delivery rate) will be 4±1 stories per week without making any detailed estimation of the individual stories.
In Kanban, however, throughput is mainly used for tracking team’s performance. Logically, the objective is to continuously improve it.
Throughput is about the number of work items that the team is capable to deliver in a given time period, e.g. week, month, provided that they keep a uniform work load.
Throughput and velocity
Throughput is similar to the agile metric velocity, however it is used differently.
Velocity is measure used in eXtreme Programming and Scrum. It shows how much work a team can complete on an iteration or sprint. The work is usually measured in story points.
Going back to the previous example team, let us assume that the five user stories delivered during the last two weeks are of 3, 4, 1, 5, and 3 story points respectively.
Then the total number of story points that can be completed in a 2-weeks sprint is 3+4+1+5+3 = 16. That is the velocity of the team is 16 story points per sprint.
Velocity also varies because of factors like story complexity, story size, changes, team skills level, etc.
Agile teams use average velocity to estimate how many features they will be able to deliver in future sprints. However, they still have to estimate the individual user stories in order to define the backlog (the scope) of a sprint.
So, although velocity is associates with speed, in fact it is about the load, usually measured in story points, which a team can carry during a fixed period of time (iteration, sprint).
Throughput and resource estimation
Throughput can be used for estimating resources.
According to the Little’s Law
If a team keeps a steady pace of work, then the average delivery time (lead time) for a certain type of work or a class of service can be considered a constant.
The delivery rate (throughput) is the target rate to be achieved in order to meet customer deadline.
Based on this we calculate the number of work items to be processed for that duration.
E.g. suppose that lead time for a story is 0,25 week. The target delivery rate is 20 stories/week. Then
WIP = 20*0,25 = 5 stories.
Assuming that a person can only work on a single story, we need at least 5 people for implementing the complete job on time. To be on the safe side (no precise formulae for this), we would better start with a team of 6 people. :-)
Little’s Law and Throughput allow estimating the
time and resources needed to carry out a job.
To sum up, throughput is easy to collect. It is a valuable measure because it keeps you focussed on team’s performance. In addition, knowing team’s throughput decreases the effort for estimating stories (requirements), provided that they are split to reasonably small chunks. Moreover, through Little’s Law, the throughput allows estimating the resources needed for completing a given job within the time expected by the client.
Efficiency is an indicator of how lean your organization is.
With respect to ITC companies:
Flow efficiency of 2% has been reported [Zsolt Fabok, Lean Agile Scotland, Sep 2012]
Efficiency between 5% and 15% is considered normal
Efficiency > 40% is good!
What causes the low efficiency?
As well explained in This is Lean, there are three main sources of low efficiency:
Long Lead time
Waiting too long for a product or service generates additional needs for the customer that also need to be addressed and usually cause additional delays.
To give an example: the longer a customer waits for the solicited application or service, the higher the probability to ask for changes or even cancel the order. In addition, managing changes increases the delivery time (Lead time) even more.
Hence
Agile teams are more efficient because they use short time iterations.
Decreasing delivery time is one of the means to increase efficiency.
A manner of decreasing delivery time is reducing the size of the work items and the batches. Therefore, when I see requirements of 500-1000 person-hours each, and iterations of 3+ months, I always recommend reducing both the requirement size and the iteration duration.
Reducing the requirements size increases efficiency.
Too many work items in process
Working on too many items in parallel
Requires additional effort, time and resource to manage them: know what was done in each one of them, where it is stored, what is pending, etc.
Leads to multitasking, which is another main source of inefficiency. Here you can see a good summary of high cost of multitasking.
Hides problems because when there are many open work items, it is difficult to spot and fix well quality problems.
Causes anxiety and stress which reduces the quality of the work, increases problem-fixing time and hence reduces efficiency.
Therefore,
Reducing the work in progress in a kanban system increases workflow efficiency.
Too many handovers
Remember how you feel when you call, for instance, your mobilephone provider and you are transferred from an operator to an operator and each time you have to explain your problem from the very beginning. From customer perspectives many handovers generate frustration.
From service provider perspective handing over a work item to another person always carries the risks of losing information and generating defects. In addition any work transfer requires additional effortand time for explaining, orally or in written form, the current status of the job and what has to be taken into consideration in the subsequent steps.
Handovers cannot always be avoided however working in
multidisciplinary teams reduces their negative effects.
Lead time is the time that passes from the beginning to the end of processing a work item.
Examples:
You decide to buy on internet an airplane ticket for your holidays. The lead time of acquiring the ticket will start at the moment you sit in from of the computer and open a browser, and will finish when you have your electronic ticket in your mailbox.
You want to see your doctor. The lead time of obtaining your diagnosis is the time between the moment you call for an appointment and the one of leaving the clinic with your diagnosis in hand.
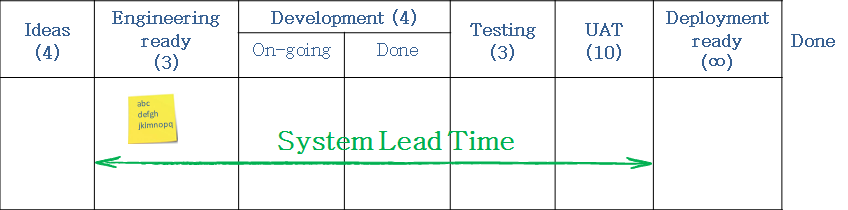
The lead time for developing a customer requirement is the time from the moment your team starts working on it until the moment the feature is ready to be released, i.e. the time that passes between the moment the feature enters and get out of the kanban system (it reaches a column with WIP limit infinity).
To measure well and consistently the lead time, it is important to know the borders of the kanban system.
Why is Lead time important for you?
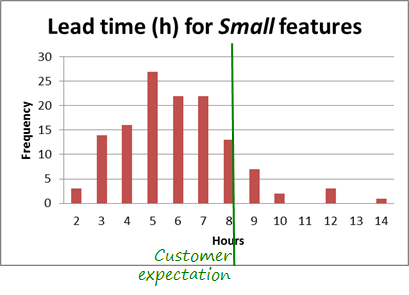
The Lead time is an indicator of value. The quicker you deliver value to your customer, the better. However, customer expectations have to be taken into account as well. Delivering too quickly not always brings value. For instance, teaching an 8 hours class in only 6 hours will not make the alumni happier.
Lead time is crucial for service oriented companies because helps establish realistic SLAs as well as manage their completion.
Knowing the Lead time distribution enables predictability. Of course, it is important to know the Lead time distribution per type of work or class of service.
If in addition to the System Lead time, you observe the time each work item spends in a column (a state), you will be able to reduce waiting and like this, accelerate delivery and stay lean (waiting is one form of waste).
It might be interesting for you to compare the value-adding time to the Lead time, in other words check the efficiency of your work. An essential moment for a customer of mine was when they found out that work developed in 6-10 hours was delivered to their customer in 35-52 days!
In a stable kanban system knowing the work in process (WIP) and the Lead time allows calculating the Throughput (applying Little’s law). Throughput is similar to the Agile velocity metric. Observing its trend gives you an indication of the overall performance of your team.
Tools for analysing Lead time
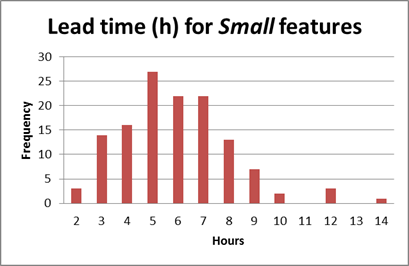
Histogram
Knowing the variation of the Lead time for features of size Small, and having an understanding of your context (clarity of the feature to develop, skills level of the team, technology, risks) you can more easily foresee the time it will take your team to implement a particular feature.
The real data already include information about the impact of the influencing factors on the development of this type of features. Therefore, you do not need a strict formulae to estimate the development time for a new requirement.
Make sure you know the Lead time distribution of your types of work
and classes of services and stop worrying about your commitments.
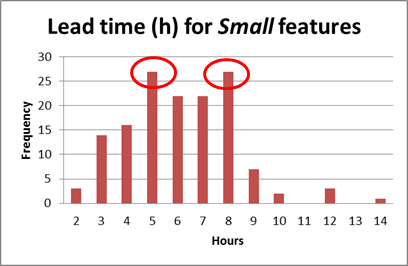
Something important. If you get a histogram like this one, with two modas, this means that you have mixed data of different types. Continuing the previous example, this would probably mean that you have mixed data about Small and Medium-size features.
Stratify the data to make sound conclusions.
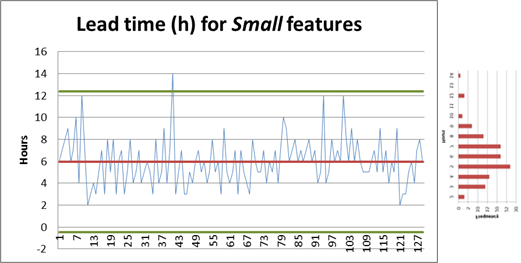
Control chart
The control chart is another form of visualizing the same data you see on the histogram, together with its mean and the upper and lower control limits.
Analyse the causes for the points that fall outside the control limits. These causes are called special causes or assignable causes. If you are not satisfied with the distance between the control limits, you could analyse the common causes for the variation and address them to reduce the variation. Like this you will improve the predictability.
Using the charts for decision making
These charts are particularly useful when you have to estimate the risk of meeting a customer expectation.
Imagine that your customer expects a new small feature in one day only (theoretically 8 working hours :-) ).
How confident would you be in committing to deliver the feature on time?
And if the customer expects it in 6 hours?
Tools
The tools that support Kanban usually build these graphics from the data in the system.
Esta web utiliza cookies propias y de terceros para su correcto funcionamiento y para fines analíticos. Contiene enlaces a sitios web de terceros con políticas de privacidad ajenas que podrás aceptar o no cuando accedas a ellos. Al hacer clic en el botón Aceptar, acepta el uso de estas tecnologías y el procesamiento de tus datos para estos propósitos.
Más información


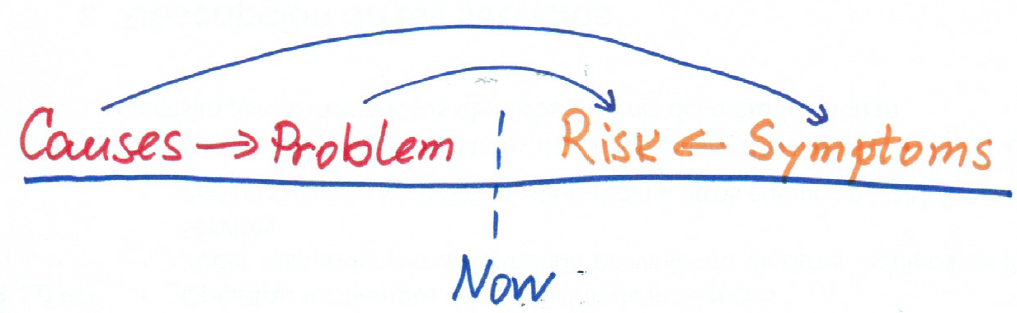 The problem from the past becomes a risk in the future. The causes from the past convert to risk symptoms that we have to carefully watch for.