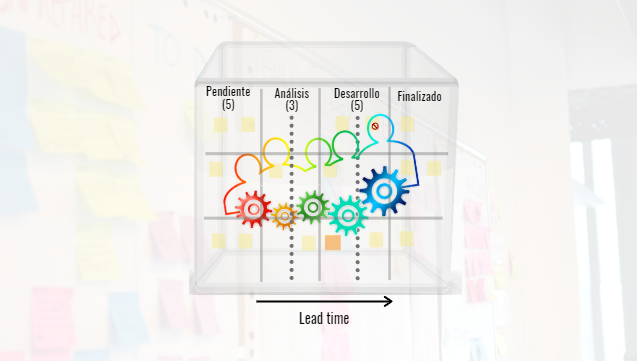
Lead time
(Delivery time, System delivery time)
Lead time is the time that passes from the beginning to the end of processing a work item.
Examples:
- You decide to buy on internet an airplane ticket for your holidays. The lead time of acquiring the ticket will start at the moment you sit in from of the computer and open a browser, and will finish when you have your electronic ticket in your mailbox.
- You want to see your doctor. The lead time of obtaining your diagnosis is the time between the moment you call for an appointment and the one of leaving the clinic with your diagnosis in hand.
- The lead time for developing a customer requirement is the time from the moment your team starts working on it until the moment the feature is ready to be released, i.e. the time that passes between the moment the feature enters and get out of the kanban system (it reaches a column with WIP limit infinity).
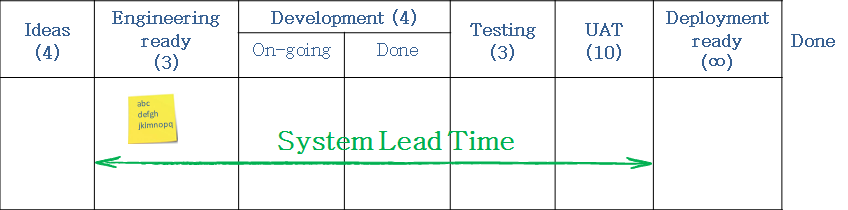
To measure well and consistently the lead time, it is important to know the borders of the kanban system.
Why is Lead time important for you?
- The Lead time is an indicator of value. The quicker you deliver value to your customer, the better. However, customer expectations have to be taken into account as well. Delivering too quickly not always brings value. For instance, teaching an 8 hours class in only 6 hours will not make the alumni happier.
- Lead time is crucial for service oriented companies because helps establish realistic SLAs as well as manage their completion.
- Knowing the Lead time distribution enables predictability. Of course, it is important to know the Lead time distribution per type of work or class of service.
- If in addition to the System Lead time, you observe the time each work item spends in a column (a state), you will be able to reduce waiting and like this, accelerate delivery and stay lean (waiting is one form of waste).
- It might be interesting for you to compare the value-adding time to the Lead time, in other words check the efficiency of your work. An essential moment for a customer of mine was when they found out that work developed in 6-10 hours was delivered to their customer in 35-52 days!
- In a stable kanban system knowing the work in process (WIP) and the Lead time allows calculating the Throughput (applying Little’s law). Throughput is similar to the Agile velocity metric. Observing its trend gives you an indication of the overall performance of your team.
Tools for analysing Lead time
Histogram
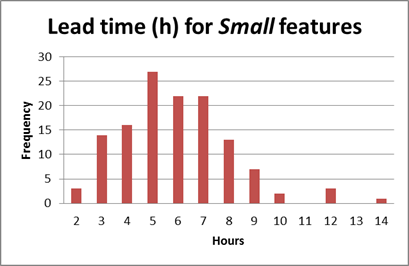
Knowing the variation of the Lead time for features of size Small, and having an understanding of your context (clarity of the feature to develop, skills level of the team, technology, risks) you can more easily foresee the time it will take your team to implement a particular feature.
The real data already include information about the impact of the influencing factors on the development of this type of features. Therefore, you do not need a strict formulae to estimate the development time for a new requirement.
Make sure you know the Lead time distribution of your types of work
and classes of services and stop worrying about your commitments.
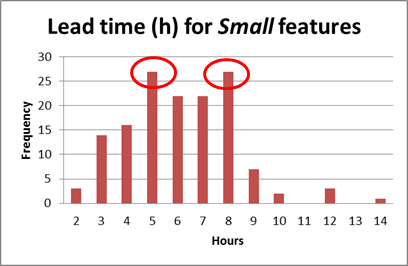
Something important. If you get a histogram like this one, with two modas, this means that you have mixed data of different types. Continuing the previous example, this would probably mean that you have mixed data about Small and Medium-size features.
Stratify the data to make sound conclusions.
Control chart
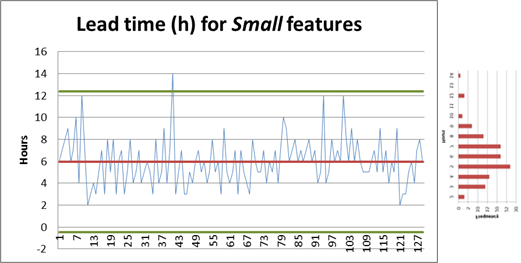
The control chart is another form of visualizing the same data you see on the histogram, together with its mean and the upper and lower control limits.
Have a look at How to interpret a Control chart for more details.
Analyse the causes for the points that fall outside the control limits. These causes are called special causes or assignable causes. If you are not satisfied with the distance between the control limits, you could analyse the common causes for the variation and address them to reduce the variation. Like this you will improve the predictability.
Using the charts for decision making
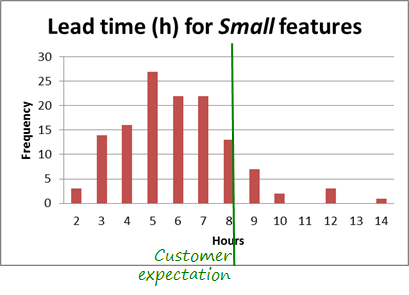
These charts are particularly useful when you have to estimate the risk of meeting a customer expectation.
Imagine that your customer expects a new small feature in one day only (theoretically 8 working hours :-) ).
How confident would you be in committing to deliver the feature on time?
And if the customer expects it in 6 hours?
Tools
The tools that support Kanban usually build these graphics from the data in the system.