If you are accountable for delivering results to your customers and you do not use yet a cumulative flow diagram (CFD) to manage your development projects and/or services, open your eyes for this tool. You will want to see it daily.
Work is considered done when it is delivered to the customer, isn’t it? Only then we can charge for it.
Therefore agile teams measure project progress by means of the number of features/stories delivered to the customer. In the very beginning Scrum started using the burn down chart showing the number of hours (or story points) remaining to completing the backlog. Later burn up charts got to be used. These plot the number of features completed by the team each day.
This information together with the velocity metric is used to project a sprint/iterationcompletion.
However, taking into account only the finished work is not enough.
The Little’s law is telling us that the Delivery time depends on the Work In Progress (WIP). WIP is all work which has been initiated and not yet finished, i.e. all work between Analysis and Done.
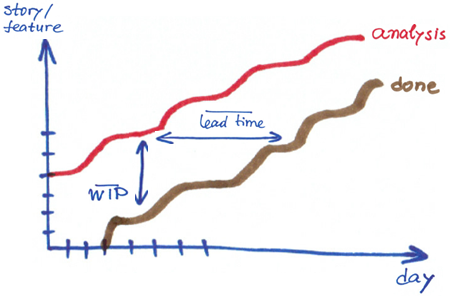
So, the first think you have to keep an eye on is the WIP.
If WIP increases, your delivery date is at risk.
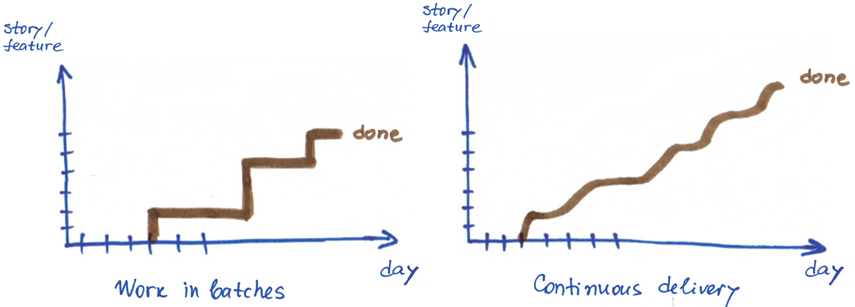
Therefore, it is much better to work with smaller sprint backlog / iteration scope (batch) sizes than with larger. Moreover, keeping a smaller amount of WIP reduces the effort spent on task-switching.
Reducing batch size increases the speed of delivery.
As a good manager, in addition to knowing what is being currently developed, you will want to know what the state of the work is, which of work items are experiencing problems, have defects, or impede the implementation of others. It is your job to ensure obstacle resolution and continuous work flow.
According to the Theory of Constraints, every system has at least one constraint (bottleneck). So you have to
- Identify the constraint
- Decide how to exploit the constraint
- Subordinate all other processes to the decision taken at step2.
- If after step 2 and 3, more capacity is needed, elevate the constraint.
- Go to step1.
How do you spot the bottleneck in your workflow?
From the Law of the bottleneck, you know that a bottleneck is the place where the throughput is lowest. Usually there is a queue before that place and the performance after that stage is not optimal. As an example, think of a tall at a high speed road, a transport bridge at a peak hour, or a security check point at an airport.
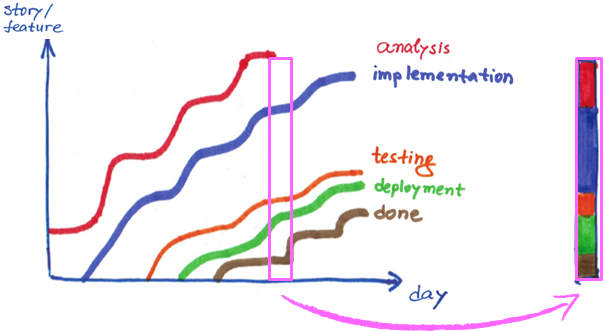
Going back to our software development workflow, we can visualise the amount of work items in each different stage from the workflow (analysis, implementation, testing, deploy, done) using lanes with different colours.
Now observe if there is a lane that is getting thinner while the one corresponding to the previous stage in the workflow is getting wider (equivalent to a growing queue).
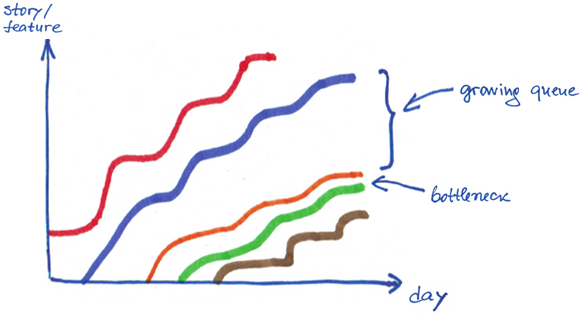
If you see this pattern, apply the above mentioned steps to resolve the bottleneck.
Keep in mind that when we see a bottleneck, we instinctively think that we need more resources. However this is usually the most expensive solution and not always the best one. See chapter 17 Bottlenecks and Non-Instant Availability in David Anderson’s Kanban book about more details on resolving bottlenecks. You might also like Esteban, the Bottleneck story.
In Cumulative Flow Diagram Pawel Brodzinski shows a number of other CFD patterns that you could find when using this chart.
To resume,
Cumulative Flow Diagram is a practical tool that helps you see the state of the WIP, your project pace and identify quickly risks associated to delivery time as well as bottlenecks.
Drawing a CFD manually requires concentration and good numeric representation skills. However, most of the Kanban tools draw this graphic automatically for you. In addition, you can choose which states to track.
For traditional management organizations:
If you are used to tracking progress against plan and estimating end date based on project’s critical path, using the CFD will still be useful for you for:
- Identifying project delay risks before receiving the next project status report
- Spotting impediments in the workflow and eliminate them before suffering their impact on accomplishing project schedule
- Get at a glance a complete picture of current work state and project pace.
Moreover, the data you need for plotting the CFD is only work item (task, requirement, story, ticket, incident) status and the time it has been in process (lead time). Corporate tools usually keep this data. What is crucial, of course, is that the data is correct, not manipulated.