The need to use a control charts sometimes scary because it sounds like ‘statistics‘, ‘only for advanced organizations‘, ‘only if the process is stable‘, etc..
All this is absolutely wrong!
If we are overweight, are not we going to look at the scale until our weight stabilizes / lower?
Usually control chart is not used because because one doe not know well how to interpret it.
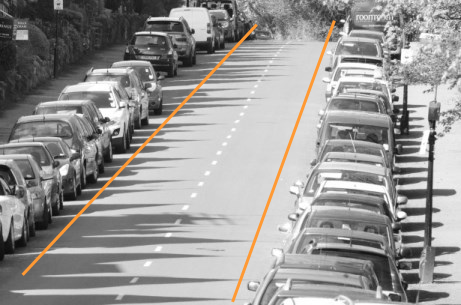
Look at this picture, please.
The white lines mark the road límits whithin which a car has to go (for now let us assume that there is only one lane). A car always moves a little closer or further from the white lines, the important thing is that it is within these limits. Goint out of them is paid and investigated (exaggerating a bit)
In mathematical terms these lines are called control limits.
Control limits determine the range in which some parameter values vary naturally. These limits may be different for each product, technology or service level agreement (SLA). For example, the effort for fixing bugs in your application. net can vary between 2 and 5 hours, and the correction of bugs in the same application for Android can vary between 1 and 3 hours.
Your analysis of the parameter has to be focused on the following aspects:
- Are the values within the control limits?
- In case that a value is beyond the control limits (eg, more effort has been dedicated to the correction of a bug), why has this happened? Analyze the causes, take action and learn, so that the case does not happen again
- Looking at the trend of the data, are the values uniformly distributed or get closer to any of the limits?
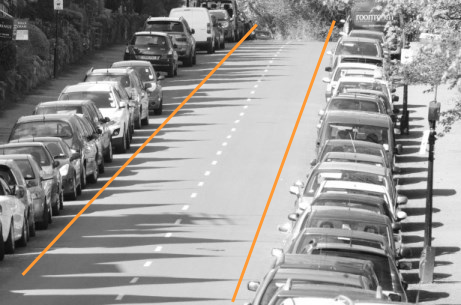
Now look at this other photo.
Because there are other cars parked in the street, our car can not go close to the control limits and must go between the orange lines (I added them). This is the case when the organization has defined limits that determine the acceptable range of variation (movement) for a parameter.
In terms of control charts these limits are called specification limits.
The reasons why an organization defines specification limits can be various: SLA, client expectations, economic margin, competitive reasons, etc.
In case that a parameter must respect the established specification limits, your analysis will have to consider the following additional aspects:
- Are values they within specification limits?
- In case that value is beyond a specification limit, why has this happened? Analyze the causes, take action and learn, so that this case does not happen again.
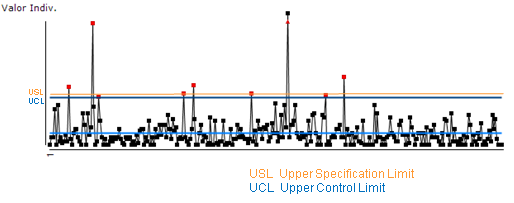
Here’s an example of a control chart with control limits (in blue) and an upper specification limit (orange).
In this case all red dots have to be analyzed because some of them are above the specification limits (set by the organization) and the other ones surpasses the control limits (natural variation).
If you have any doubts, let me know.


