How long does it take to drive from your home to your office?
It takes me about 15 min. If I have to be more precise – between 15 and 20 min, depending on the traffic.
These three photos are from the Romo tunnel that I pass through almost every day. Before 7:15-7:20am the traffic through the tunnel is smooth and fast. Afterwards, it starts to slow down. From 7:40-7:50 until around 9 you can spend a good time standing, listening on the radio that this highway is collapsed.
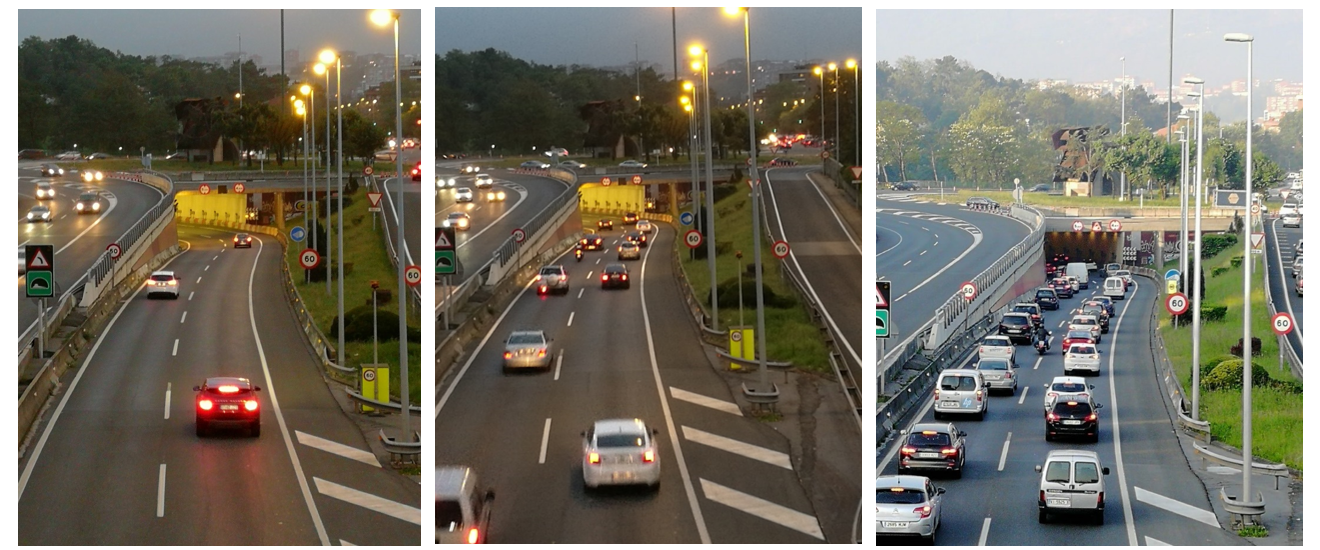
The more cars on the road, the slower the traffic.
When it comes to travelling, even if it is a daily commute, we understand that the time it usually takes varies – it depends on how much traffic there is on the road and how long we stay stuck at red lights, junctions, roundabouts or traffic jams.
Sometimes unforeseen events occur – an accident or a close section of the road – for example, to give priority to a cycling tour, due to construction or flooding. So, you have to find another way. And, if we are traveling on an unknown road and we get lost (this happens to me often 😊), then the time to reach the destination also depends on how long it takes us to find the right way. That is, to the usual trip time we add the unforeseen event resolution time.
Pay attention that when travelling we get anxious not when we are moving normally, but when we are stopped or looking for the right way. Then we start looking at the clock and, if necessary, call to inform that we are late.
The project execution situation is similar, but more complicated. The delivery time depends on the work execution time under normal conditions, plus the time the work spends waiting for something, plus the unforeseen events resolution time.
Project execution time = Work execution time + Waiting time + Unforeseen events resolution time
You can substitute project execution by product development or service execution; the equation remains valid.
Waiting in projects and services is typically caused by other tasks or projects that are carried out in parallel, by approvals, because another team is busy and cannot continue the work immediately, or by waiting for a supplier or the client himself.
Unforeseen events also occur in projects and services. For example, a person or a team is planned to be involved, but when their job is ready to start, they are not available. It also happens that an initial solution happens to be inappropriate, and an alternative has to be found.
Treat project execution as a journey. Control the time that the work is stopped (blocked), moves slowly or is affected by an unforeseen event.
The metrics that help you control the project and service execution time and put an end to delays are called flow-related metrics.
Flow-related metrics
The following image visualizes the different flow-related metrics:
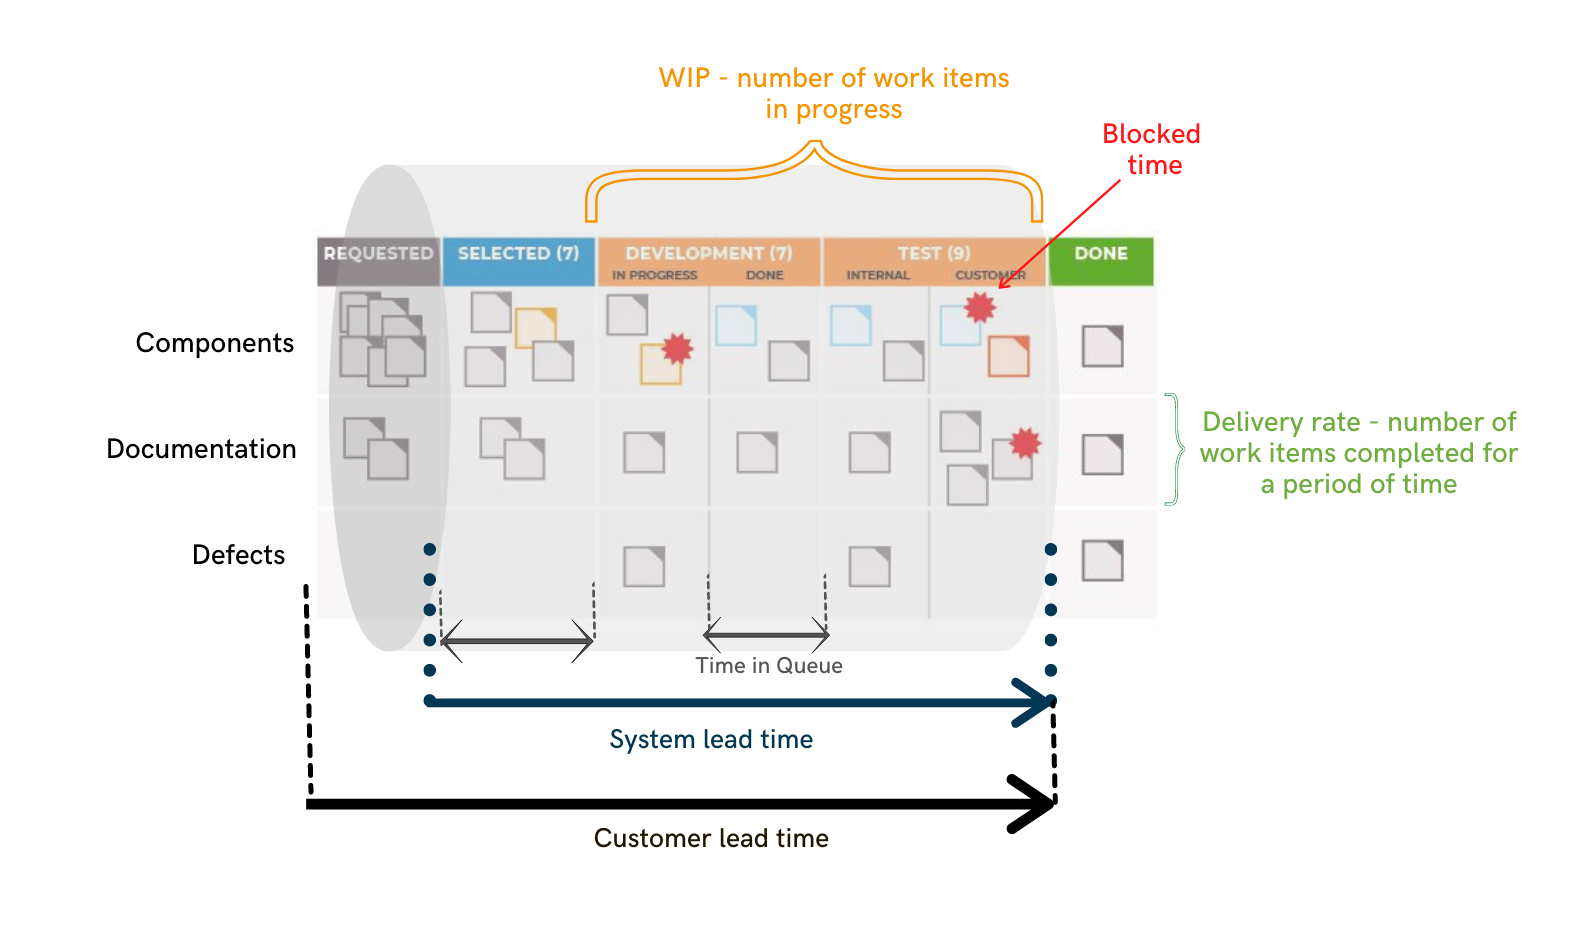
System lead time –the time that from the moment you start working on a work item until the moment it is delivered to its customer. This time includes the waiting time.
Customer lead time – the time from the moment when the customer has placed the work order until the moment when they receive it.
Blockage time – the time that the work item is stopped by some impediment in the workflow.
Take notes of the blockage causes, so that you can analyze them and understand their impact on the project and service execution times. This will help you define effective actions to reduce delays.
Queueing time – the time the work item is waiting for a person at the next step in the process to be able to do it.
The most effective way to take this metric is by configuring your tool so that it collects the data automatically.
Delivery rate (Performance; Throughput) – the number of work items completed for a period of time. Measure the delivery rate by type of work so that you can analyze your delivery capacity.
Work in Progress (WIP) – the number of work items in process.
Following the example of traffic, the WIP corresponds to the number of vehicles (motorcycles, cars, trucks and extra long vehicles) on the road.
The WIP strongly conditions the execution time of projects and services. Therefore, it is key to control it. However, this is perhaps the most difficult practice for the organizations.
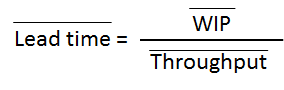
The Little’s Law describes the relationships between Lead Time, Work in Process, and Delivery Rate.
Nowadays, companies are looking for greater predictability and short delivery times for their products and services. Flow-related metrics are your means to identify causes for delays and define relevant actions. Use them.
What to do if you still have to give a specific date or delivery time? – Understand the range of variability of your delivery time and respond by evaluating the risk of not meeting the given deadline.
We will talk about this in another blog post.
Teodora Bozheva
Accredited Kanban Trainer & Consultant
Co-author of the Kanban Maturity Model
www.berriprocess.com
Related posts: