“We copy the same information in several systems because it goes to different reports”,
“Following the defined process is like having a parallel life of the daily work. Therefore we create all the paper work before the audits”,
“We need lighter processes”, etc, etc.
Does any of these phrases sound familiar?
How do you resolve the dilemma of having processes that comply with a particular model or standard, and at the same time keep them fit?
I would be happy to hear your experience. Meanwhile I will share mine with you.
Lots of process improvement consultants will tell you that implementing or improving CMMI, SPICE or ISO should be done process by process, namely focussing on a particular group of practices (activities, procedures) and deciding how they should look like. Implement the changes and stepping to the next process.
I was also doing so years ago. Although this is not too bad, it is a local, partial improvement that not necessarily has to demonstrate a positive improvement of the entire workflow. In fact, this is one of the main reasons for loading processes with too much extra work.
Adding some extra work to a single process is not a problem. However, summing up the extra work for all the processes turns to an obstacle for performing the work well and quickly.
Therefore I follow a different approach, a Lean one.
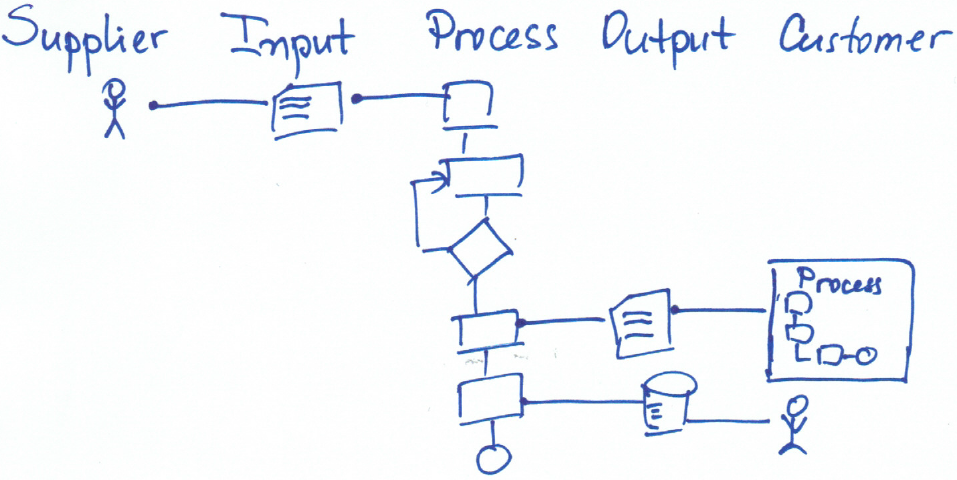
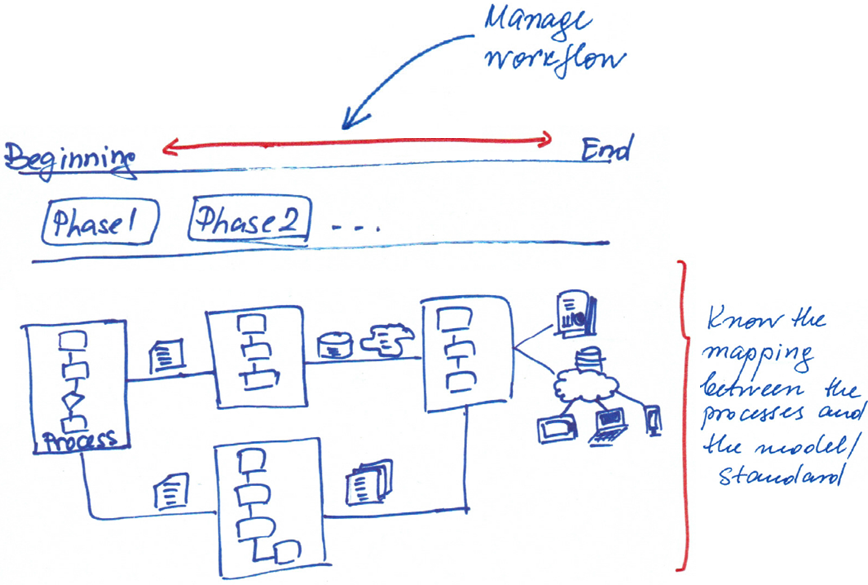
First I try to understand the entire workflow from beginning to end, both value-producing steps and information management ones. Together with the team of people from the company, for each group of practices, we draw a SIPOC diagram showing the steps to follow (P), the input (I) necessary for executing them and the outcome (O) obtained. We check that the input is available, either from another process or a supplier (S) and that the output is necessary for another process or a stakeholder, customer (C).
This ensures that the processes produce only needed outcomes, i.e. no over-processing.
By focussing on and performing only work that is required, we save effort of the staff, other resources and delivery time. In addition, it leads to higher efficiency as employees are concentrated on value adding tasks that the customer is willing to get and pay for. Moreover, people are not frustrated with developing an obsolete outcome.
The other important check is making sure that all processes involved in the workflow are perfectly integrated, i.e. the very initial input flows smoothly through them, being gradually transformed into a final outcome.
Improving the workflow consists of making the transformation paths shorter(less transportation and motion) and faster(less waiting).
Last, but not least, to make sure that we do not produce obsolete paper, we fill in the following table that summarizes the inputs and outcomes for each process. Only, if an outcome is a paper document, we include the name of the respective template. Location is the place or the system where either the document or the data is stored.
What we thoroughly check at this point is that there is no duplicate information among the documents and the systems used. Also, where it makes sense, we merge the documents to prevent having too many pieces of documentation spread across different places. Undoubtedly, automation is always helpful.
The meaningful indicators of whether we have achieved real improvement are, of course, (1) the opinion of team who uses the processes and (2) the performance of the entire workflow.
Therefore I carefully listen to them two.
With this post I try to help Esteban, a real and concrete person. However, I also believe that the ideas could be helpful to others in similar situations.
Esteban is in the software development branch. Projects for different clients, all with their particular requirements, critical issues and urgent matters to resolve. Nothing surprising for a person of the IT world. What is interesting is the situation in which Esteban is:
He leads 5 projects and is involved in other 8 projects as Technical Lead, responsible for designing the solution.
All projects use technologies that are new for the IT domain as well as for the team members.
In addition to making his own work, Esteban gives training in new the technologies to the people involved in the projects, helps them with any questions at their work, fixes the mistakes they cannot correct, speaks with clients clarifying features (both implemented and new or modified )
More precisely, this means that every day dedicates time to some 20-25 colleagues, discussing different issues, when they arise, without any order or schedule, and spending about 10-15 min with each one of them takes him about 5-6 working hours daily. Between the conversations he tries to restart his interrupted work …. until the next interruption. The result is the following:
Esteban’s incomplete work accumulates,
the queue of those waiting for their responses is increasing,
Customers of different projects are getting unhappy, because of the slow resolution of their problems
Esteban’s Boss is unhappy because has Esteban has become a “bottleneck” and does not “manage to handle” all the tasks.
Does this situation sound familiar to you?
What would do you to resolve it?
I see three options and will try to explain them and demonstrate them here.
Look at this bottle.
It contains the work that must pass through the bottleneck, i.e. the work that Esteban has to do.
The first option is “do nothing” or leave the colleagues to find their way to getting the work done, just pushing the work pass as quick as possible through the bottleneck.In this case it takes some 11:07 seconds to empty the bottle (complete work). Air bubbles enter the bottle irregularly and help the water pours, yet you can see that the flow is not smooth.
The second option is to put some order, for example, define a period of time in the day when Esteban will respond to the doubts of his colleagues, establish some rules about what types of questions will be addressed to Esteban, and how to deal with truly urgent matters that cannot wait until the hour of questions.Let us visualize this option: The timer also shows improvement. The water takes 7:93 seconds to get out of the bottle. 28% reduction of the delivery time
The third option is as follows (we first demonstrate it)
The same amount of work passes through the same bottleneck in 5:60 seconds only! Additional reduction of the delivery time by 29%. Or 49% quicker comparing to the first case.
How is it possible?
The air entering through the straw makes the water flow smoothly and permanently, without stops and re-starts (caused by air bubbles, as in the first option).
In Esteban’s case what would be equivalent to air entering through the straw?
Well, the answer to this question can be found only with those directly involved in the situation. What I can just suggest is the following:
Visualize the ongoing work in the projects so that all involved can discuss, prioritize and agree what to do to achieve a smooth and constant flowof results. Not ensuring that everyone is busy, but making sure that the results that provide value to customers are being developed.
The bottleneck is a valuable resource and at the same time it limits the flow of the water. Therefore we have to use it smart, not waste it. That is Esteban has to be always engaged in tasks that require his knowledge level and skills, and does not waste time on other work which only slows down the workflow.
Find a way to elevate the bottleneck, making it possible that other team members be able to help with the specific jobs. (this requires most time and effort)
Variation is “the act, process, or result of varying” or “a change in the form, position, condition, or amount of something”. [Merriam-Webster dictionary]
Variation is inherent in any process. Going to work every day takes different time although we go the same way and approximately at the same time. Preparing a routine report also takes different time every time we make it. Two developers asked to implement the same simple functionality in the same environment will need different time as well.
The variation in our performance affects the time of project or service completion, the quality of the outcomes, the internal organization of the team activities, the workload of the individuals, etc. I am sure you can add a lot more examples to this list.
It is important to recognise the nature of variation to be able to address it correctly.
Causes of variation
The causes of variation can be different:
Resources: an error in an application could cause a routine procedure to take longer than usual, different personal skill levels make the service delivery time vary, handing over a task to another person usually alters both the time and the quality of the work completion.
Processing unit: the complexity of a customer request affects the development/response time, different tools need different installation and setup time, defects require different fixing time and effort depending on their characteristics.
Other factors: errors in the income tax submission application occur in the ‘season’ of tax declaration submitting, most of the printer-support calls occur during the working hours, a change or an unavailability of a team member affects the team performance, delay in receiving some information or materials affects a service delivery, the arrival rate of phone calls/incidents impacts the response quality and the customer satisfaction.
People, independently on whether they are involved in a process as a processing unit (e.g. patient, customer) or as resource – actor, introduce natural variation in the process, which is practically impossible to avoid.
In the services area response time and predictability are key to customer satisfaction. Thus it is important to keep the process variation relatively low and even reducing it to become more competitive.
Speaking about delivery time, what is interesting is that waiting time is frequently the largest component of the elapsed process time. E.g. in a travel from Yerevan to Bilbao the flights take 52% of the total travelling time, the rest is waiting; in a doctor visit, the value-adding time is about 15 min (the visit in itself) within e.g. 6 hours between calling for the appointment and leaving the clinic, i.e 96% of the time is waiting.
Make yourself an experiment. Measure the effective time of doing something (the time you really work on it), for instance, fixing a bug. And measure the time from staring to finishing it. What is the ratio between the two measures?
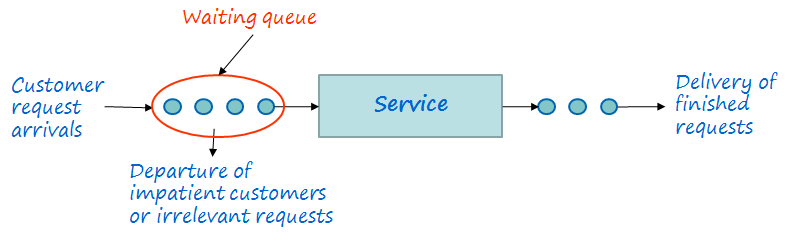
To understand the effects of the variation and how to cope with them, have a look at the following simplified picture of your organization:
Fig. 1 Queuing system (simplified)
In this case we represent your organization as a queuing system: “customers arrive for a given service, wait if the service cannot start immediately and leave after being served” or “customer asks for implementing a requirement, waits for the implementation to start and pays when the requirement is delivered”
Sir John Kingman’s formulae links the factors that determine the time a customer will have to wait until her request is served. Therefore sometimes it is called the law of the variation effects. The formulae says that
Average Waiting Time = f(Arrival Variation, Resource Utilization,
Effective Process time)
More precisely, for a simplest queuing system the average waiting time spent in queue, depends on the Variation of request arrival, the Resource Utilization, and the time a request is Processed.
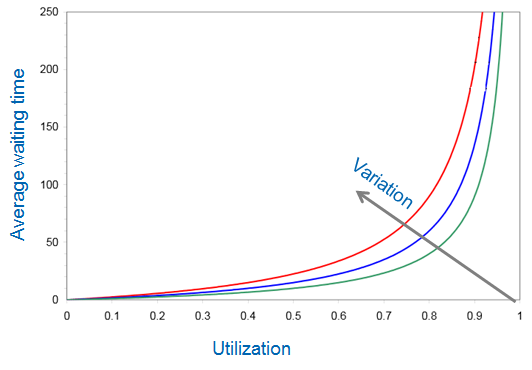
Fig 2. Trade-off between Waiting time, Resource Utilization and Arrival Variation
The effects of the variation
The two effects of the process variation can be described as follows:
Looking at one curve only: When the resource utilization is close to 100% a small increase in the work load causes an exponential increase of the time to finish the job.
Comparing the two curves: Assuming that the resource utilization is the same, the higher the process variation, the longer it takes to complete a job.
Practical take-aways for a project or service manager
The higher the resource utilization, the stronger variability affects the time of completing a service or a piece of work. If utilization is low (~50% or less), variation in the request arrival and process variation will have a small impact on performance. Something very important for organizations aiming at ensuring that their resources are always busy.
In software development and IT services people are the main resource. Therefore, utilization is strongly affected by errors which generate failure demand or rework. Thus, reducing resource utilization is more critical than reducing time variation.
The longer the average process time, the larger the time requests will spend waiting and hence, the larger the queue length. Therefore decomposing a job into smaller pieces that take less time to complete reduces the overall processing time. Developing several small services/tasks produces less variation than one big one.
Said this, how to reduce customer/request waiting time?
Reducing the incident/request arrival rate, for instance by improving user documentation, providing better web-based support, making user interfaces more intuitive, offering training, etc.
Reducing service time (effective processing time) by improving technical staff training, automating the process, etc.
Reducing process variability by analysing and eliminating the causes for very long duration services, introducing policies that facilitate service prioritization and fulfilment.
The smoother a request passes through the process (with less stops, restarts and bottlenecks), the shorter the process time and hence the waiting time and the queue length. Hence removing bottlenecks and other impediments in the workflow reduces waiting time and the elapsed processing time.
Reuse reduces variability in completion time. Therefore wherever possible and makes sense work outcome and knowledge have to be reused. I say “make sense”. Some time ago I was working with a company that admitted they were suffering the “Until In Stock” virus. They were reusing old hardware components until available on stock and that was causing them high cost of defect fixing.
Variability is not necessary a bad thing. Achieving high predictability and service level completion is nice, however repeating always the same results also means that nothing new is created. It is not by chance that Henry Ford said “If I had asked people what they wanted, they would have said faster horses.”
If Apple were only doing the usual job, they would not have envisioned the iPhone either.
More about the positive side of variability will come in another post.
The bottleneck law has its origin in the Theory of Constraints, created by Dr Eliyahu Goldratt and published in 1984 in his book “The Goal”.
The law says that every system, regardless of how well it works, has at least one constraint (a bottleneck) that limits performance.
The law allows us to deduce the response time and performance limits of a process – essential information for IT services and software development projects.
Focusing improvement efforts on resolving the bottlenecks is the quickest and most effective path to improving profitability.
Bottlenecks can involve people, information, tools, procedures, and may be internal or external to the organization.
A bottleneckis the stage in the process in the form of sub-processes or activities that limit or block the flow. The throughput in the bottleneck is lower than in the rest of the stages. In other words, it is the stage at which the elapsed time for a work unit to pass through the system is largest.
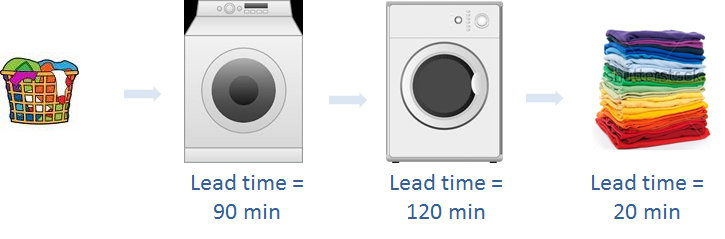
For example, let us have a look at the process of “laundry washing-drying-folding”
The bottleneck is the drying machine because at this stage of the whole process the lead time is largest.
Processes involve different people, activities and tools and each of these has different performance. Therefore, if the activities of a process has to be executed in a sequential manner, for example
Here I will only summarize the approaches to bottleneck resolution:
Fully exploit the bottleneck resource: make sure that the resource only does the activities she is specialized in and assign the remaining activities to other resourcesFor example, we have a specialist in software integration and because of his involvement in various projects he becomes a bottleneck. An option will be to let him do only integration tasks and assign other tasks to other team members.
Increase resource availability – the frequency with which the resource is available even for a shorter time.Example: The integration specialist can dedicate one day a week to each project. A more efficient solution is that he/she dedicates each project half a day twice a week than a full day only once a week.
Automate part of the activities .
Increase the resource (elevate the bottleneck) – usually the most expensive solution.Following the example above this is equivalent to hiring another person with the necessary knowledge and experience in software integration.
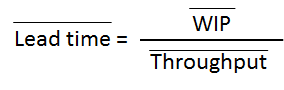
The origin of Little’s Lawis the Queuing Theory and it is perhaps best known law in the IT systems performance modeling.
The law shows the relationship between Lead Time, Work in progress (WIP) and Throughput.
Lead time: The period between the entry of a request in the system and the receipt of the request. It is measured by the elapsed time (minutes, hours, etc). The request may be a requirement, a user story, an incidence, material, a request from a user, etc..
Work in process (WIP): the number of requests (work units) that are being processed, i.e. they have entered the system, but have not got out yet
Throughput: the number of work units leaving the system at a given time, e.g. 3 user stories per day.
The conclusions of this law are equally interesting and important:
The larger the WIP, the longer the lead time, i.e.the more it takes to finish the job started . In other words, to meet development or service deadline, we must reduce the work in process, or finish it before starting a new jobs. However, in lots of cases exactly the opposite happens: the teams start working on lots of tasks so that the whole project “goes” faster. Another reason for which one wants to ensure a lot of ongoing work is to achieve high resources utilization.Whatever the reason, assuming that the Throughput does not change, the increase of work in process also increases the time required for its completion (the Lead time).
Although it may seem counterintuitive, remember that reducing WIP helps meet SLA and reduce development Lead time.
Focusing on reducing Lead time helps identifying obsolete activities that are carried out . Eliminating them has two positive effects: (1 ) eliminates waste in processes, and ( 2) reduces total WIP, which leads to shorter Lead time and a more efficient development .
The higher the Throughput, the shorter the Lead timeThere are different ways to improve performance: automating value-adding activities (automating non-value-adding activities is equivalent to automating waste production), improving processes or adding more resources. If you decide to add more resources, observe the overall lead time because the additional resources add more work in progress as well.
Each Lean initiative seeks to minimize waste and shorten production cycle. Reducing the production cycle is equivalent to reducing the Lead time. Minimizing waste includes an analysis of current inventory and the steps to reduce it. This is equivalent to reducing WIP.
Why is this law important for Project Managers?
Little’s law is a tool to know the real performance of a software development team or an operations one
Provides predictability
E.g. if we have to implement 50 requirements and the average team capacity is 5 requirements per week, the time that we will need is 50 requirements / 5 requirements per week = 10 weeks.
Shows that the larger the work batch, the longer the processing time, the Lead time
Explains why multi-tasking delays instead of accelerating work completion.
Usually people believe that working on multiple tasks in parallel increases productivity. Therefore, assigning several tasks to a person is a common practice in the companies. However, unlike the machines, people are not so good in the execution of parallel processes. Increasing work in process also increases the time to change and re-start a task and therefore reduces throughput. As a result, the time to execute the work gets insufficient, and the started but not finished job begins to accumulate. In short, Little’s law helps finding the balance between the work in progress and Lead time.
Provides the foundation to reaching optimal WIP limits. If WIP limits are below the optimal level, there are underutilized resources and performance is low. If the WIP limits exceed the optimal level, then work units start piling up in queues and this also reduces performance.
Helps understand the effects of blocking a job or having to fix errors on project or service deadlines. In both cases it reduces Throughput and hence increases the Lead time.
Important conditions for applying Little’s Law:
Little’s law is very useful, however in addition to knowing the formula you have to take into account the conditions that have to be met for the law serves you:
Use average values for all parameters: average lead time, average WIP and average throughput
Units must be consistent, i.e., if we measure throughout in a week, the lead time also has to be a week, as well as the average WIP
The system has to be stable, i.e. all the work that enters the system, has to go out of it; the total WIP at the beginning and at the end of the period has to be constant, the average arrival rate of work has to be equal to the average departure rate of work.
To summarize, the correct use of Little’s law helps achieve a smooth and steady workflow, and improves the predictability of projects and IT services. Work in process (WIP) is a key factor for project performance and the time to complete a software development or a service. Limiting WIP reduces Lead time and, in addition, leads to reducing waste in the workflow.
Esta web utiliza cookies propias y de terceros para su correcto funcionamiento y para fines analíticos. Contiene enlaces a sitios web de terceros con políticas de privacidad ajenas que podrás aceptar o no cuando accedas a ellos. Al hacer clic en el botón Aceptar, acepta el uso de estas tecnologías y el procesamiento de tus datos para estos propósitos.
Más información