At Ekide Group, a leading technology company, they needed to be able to manage all their projects without losing themselves in detail and without slowing their growth speed. The Kanban method and the Kanbanize tool have been the key elements to achieve this.
The case of the introduction of Kanban in Ekide Group is a very important case not only because of the results they achieved, but because of the learning and evolution that the organization experienced. It is usually said that transformation processes take several years, distract staff with new work practices and cost millions of euros… but that is not what happened at Ekide Group.
(A true story; the names of the woman and the company are changed).
Ana is the PMO director at Compagil and this year she is leading a strategic initiative.
In the recent years the company has carried out different initiatives – some business areas have piloted Agile practices, others Kanban. The usage of OKR has been studied at the strategic level. The COO is advocating for using Lean in order to improve process efficiency and reduce costs. The Talent and Culture area is focused on introducing a culture of collaboration, transparency and customer orientation.
Despite all the pilots running in parallel, project management is still done and reported in the classic manner.
The people responsible for each initiative have their ideas and proposals of what management practices have to be introduced in the company. However, the conversations between them are not very fruitful, one has the feeling that they speak in different languages.
So, Ana’s goal is to harmonize the use of all the methods and terminologies and define the company’s standard project management process and its tailoring guidelines according to the different project characteristics and circumstances that occur in their execution.
“Defining a common language that accommodates the ideas and concepts of all these different methods in the company’s vocabulary, is a difficult task in itself. However, the metrics issue is even more complicated.” told me Ana.
“All the methods bring their metrics and in Compagil we use others historically. I do not understand the relationships between Agile metrics, Kanban, KPIs and OKRs. It is impossible and counterproductive to measure everything and track every aspect that the methods suggest. So, what do we really have to measure and without losing control over our projects?” continued Ana.
More and more often I have this same conversation. Therefore, I thought that responding to these doubts in a post could help you too. Of course, if you are in a situation similar to Ana’s, you should bring together your colleagues who are involved in the different initiatives, and, together, develop the appropriate solution for your company.
OKRs, metrics, KPIs – what is it and how to use them?
Each company is unique. Therefore, I am going to concentrate on the main concepts and how to use them in the development of your solution.
1. Define Objectives and Key Results (OKRs)
Essentially, an initiative of this type should resolve real organization’s problems to be useful.
Therefore, start by identifying the main pain points.
Based on these, define the organization’s objectives for the year, the next quarter or another relatively short period of time.
Then, define what results would demonstrate progress or achievement of each one of the objectives. Think about tangible and measurable results, not just actions.
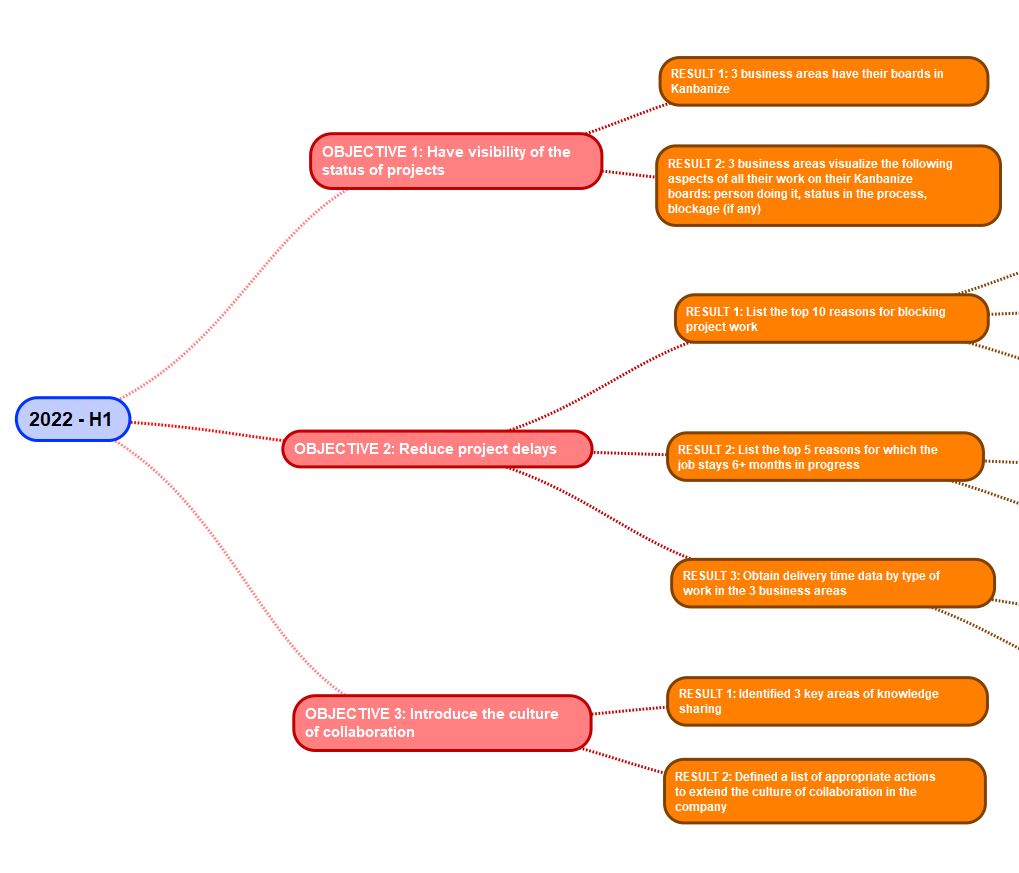
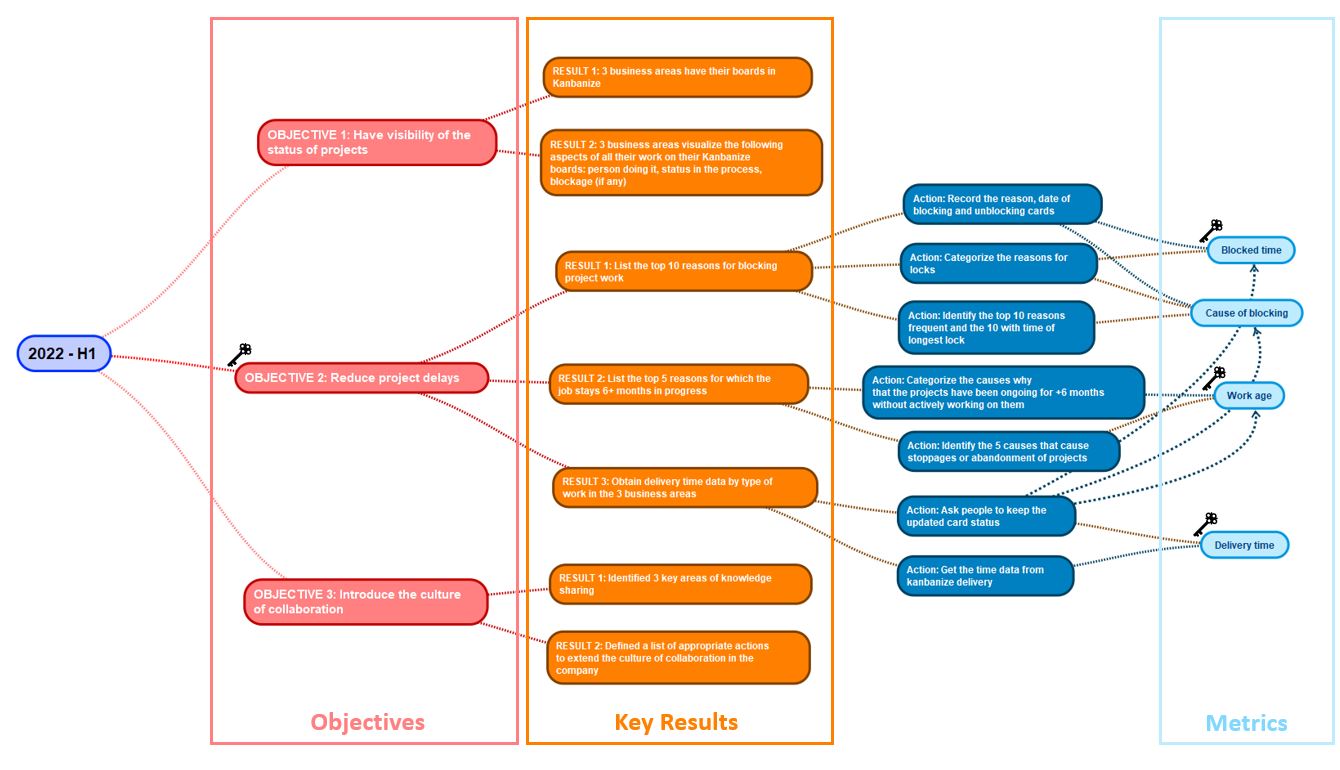
An example of objectives and key results is illustrated in the following image:
OBJECTIVE 1: Have visibility of the project status
Result 1: 3 business areas have their boards in Kanbanize
Result 2: 3 business areas visualize the following aspects of all their work on their Kanbanize boards: person doing it, status in the process, blockage (if any)
OBJECTIVE 2: Reduce project delays
Result 1: List the top 10 reasons for blocking project work
Result 2: List the top 5 reasons for which the job stays 6+ months in progress
Result 3: Obtain delivery time data by type of work in the 3 business areas
OBJECTIVE 3: Introduce the culture of collaboration
Result 1: Identified 3 key areas of knowledge sharing
Result 2: Defined a list of appropriate actions to extend the culture of collaboration in the company
Use the complete image of your objectives and key results to agree what to focus the attention of your organization on. Make sure that you all have the same understanding of your objectives and results to be achieved and that these are aligned with the strategic direction of your company.
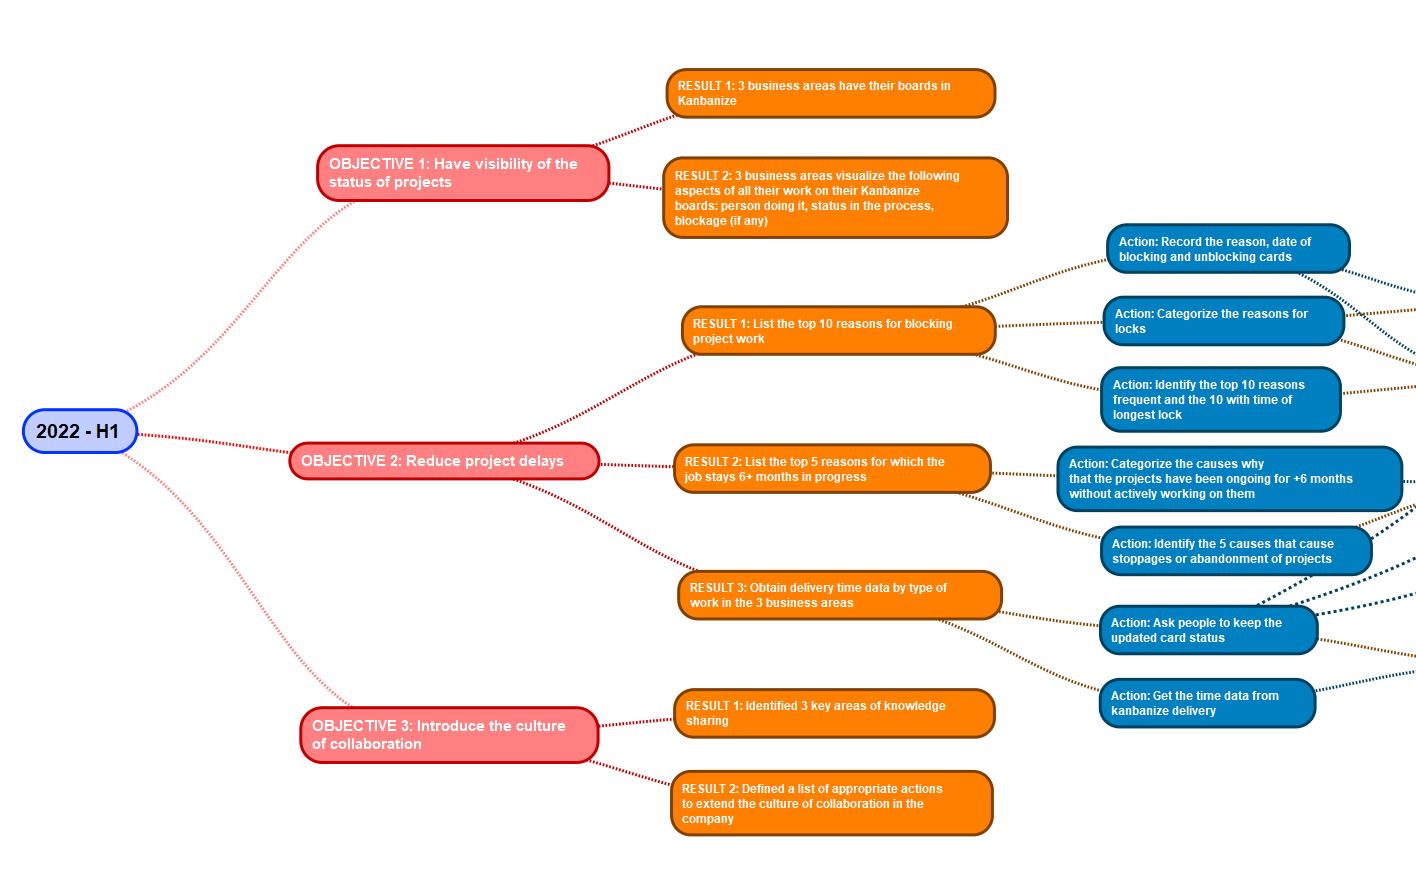
2. Define actions and metrics
The next step is define the appropriate actions to achieve the results. Following our example, these could be:
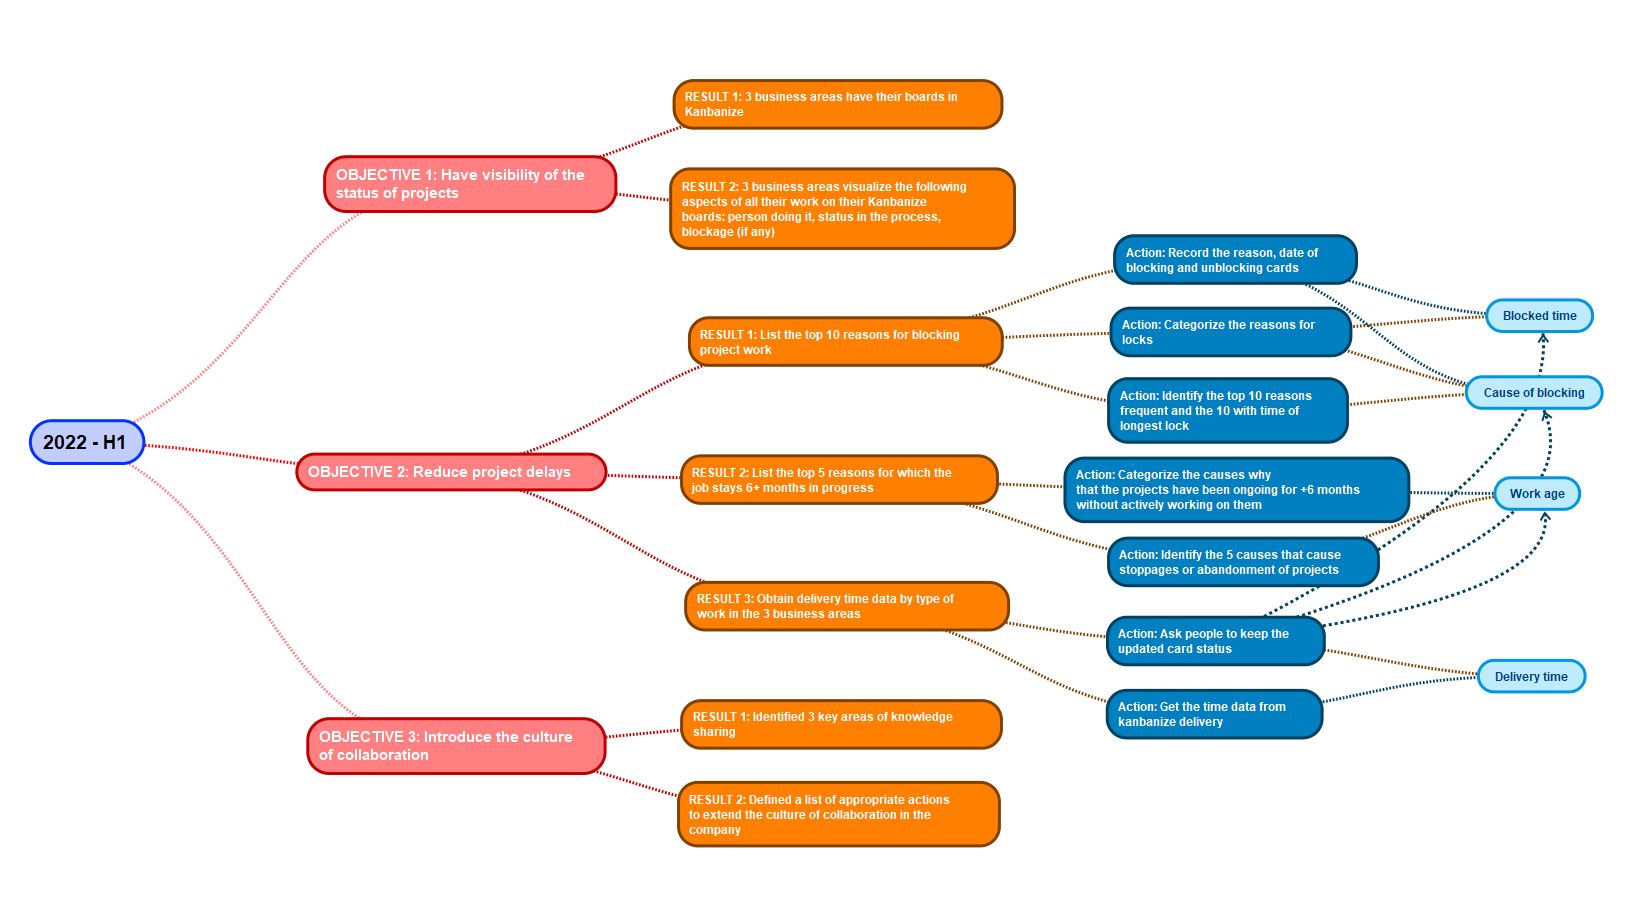
And now we come to the question “what metrics related to the actions allow you to demonstrate / evidence the results?”.
For example, to get the top 10 causes of workflow stops, we need to get the list of the causes for the blockages, as well as the time the work items stayed blocked due to them.
Stay focused. If your tree gets too branchy, focus on the 3-5 most important objectives and 2-4 results/outcomes per objective. You can address the other aspects In the next improvement cycle.
You see the relationships between OKR and Metrics, do not you?
3. Define KPIs
KPIs (Key Performance Indicators) measure the completion of business goals. Therefore, they are called Key. KPIs indicate whether the business is healthy and developing well.
Typically, these indicators are related to the following:
Meeting customer expectations
Time to market; product and service delivery time, as well as customer delivery time
Efficiency of key organizational processes
Product and service quality
Employee satisfaction
Both, improvement objectives (related to pain points) and KPIs can be defined for each level of the organization.
If any of your improvement objectives is related to a business goal and, therefore, to a KPI, mark it to make it explicit for the entire organization.
For example, let us assume that Objective 2: Reduce delays is related to the business goal Reduce time-to-market. Then, the indicator for project delays is KPI. Therefore, the Lead Time and Blocked Time metrics that are associated with this KPI and are key as well.
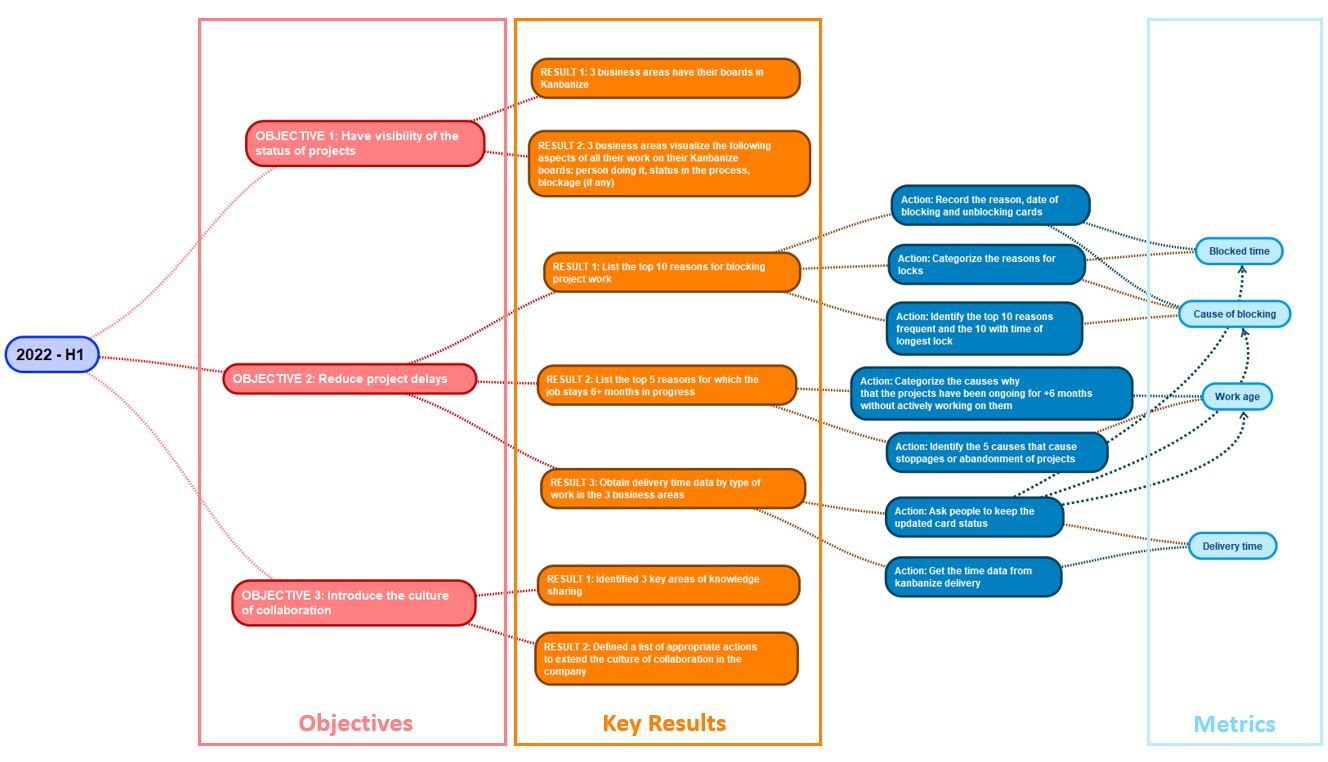
Now you have the complete map that you can use to agree and focus the attention of the entire organization on what is important to you.
Conclusion
To wrap up, the improvementobjectives are related to current pain points, a specific need of the organization, or a business objective. The results demonstrate the progress towards the objectives. Achieving them requires taking some actions. The metrics allow monitoring and making the right decisions to achieve the objectives. KPIs are indicators and metrics that are related to the achievement of key business goals.
It is important to understand how to define the complete system of objectives – results – actions – metrics. It is even more important to use them effectively to achieve improvements for the organization. Therefore, concentrate on the few objectives and vital results that are important for your company.
Visualizing the relationships between goals, results, actions, and metrics allows you to communicate and align around these goals.
Teodora Bozheva
Accredited Kanban Trainer & Consultant
Co-autora del Kanban Maturity Model
www.berriprocess.com
How long does it take to drive from your home to your office?
It takes me about 15 min. If I have to be more precise – between 15 and 20 min, depending on the traffic.
These three photos are from the Romo tunnel that I pass through almost every day. Before 7:15-7:20am the traffic through the tunnel is smooth and fast. Afterwards, it starts to slow down. From 7:40-7:50 until around 9 you can spend a good time standing, listening on the radio that this highway is collapsed.
The more cars on the road, the slower the traffic.
When it comes to travelling, even if it is a daily commute, we understand that the time it usually takes varies – it depends on how much traffic there is on the road and how long we stay stuck at red lights, junctions, roundabouts or traffic jams.
Sometimes unforeseen events occur – an accident or a close section of the road – for example, to give priority to a cycling tour, due to construction or flooding. So, you have to find another way. And, if we are traveling on an unknown road and we get lost (this happens to me often 😊), then the time to reach the destination also depends on how long it takes us to find the right way. That is, to the usual trip time we add the unforeseen event resolution time.
Pay attention that when travelling we get anxious not when we are moving normally, but when we are stopped or looking for the right way. Then we start looking at the clock and, if necessary, call to inform that we are late.
The project execution situation is similar, but more complicated. The delivery time depends on the work execution time under normal conditions, plus the time the work spends waiting for something, plus the unforeseen events resolution time.
Project execution time = Work execution time + Waiting time + Unforeseen events resolution time
You can substitute project execution by product development or service execution; the equation remains valid.
Waiting in projects and services is typically caused by other tasks or projects that are carried out in parallel, by approvals, because another team is busy and cannot continue the work immediately, or by waiting for a supplier or the client himself.
Unforeseen events also occur in projects and services. For example, a person or a team is planned to be involved, but when their job is ready to start, they are not available. It also happens that an initial solution happens to be inappropriate, and an alternative has to be found.
Treat project execution as a journey. Control the time that the work is stopped (blocked), moves slowly or is affected by an unforeseen event.
The metrics that help you control the project and service execution time and put an end to delays are called flow-related metrics.
Flow-related metrics
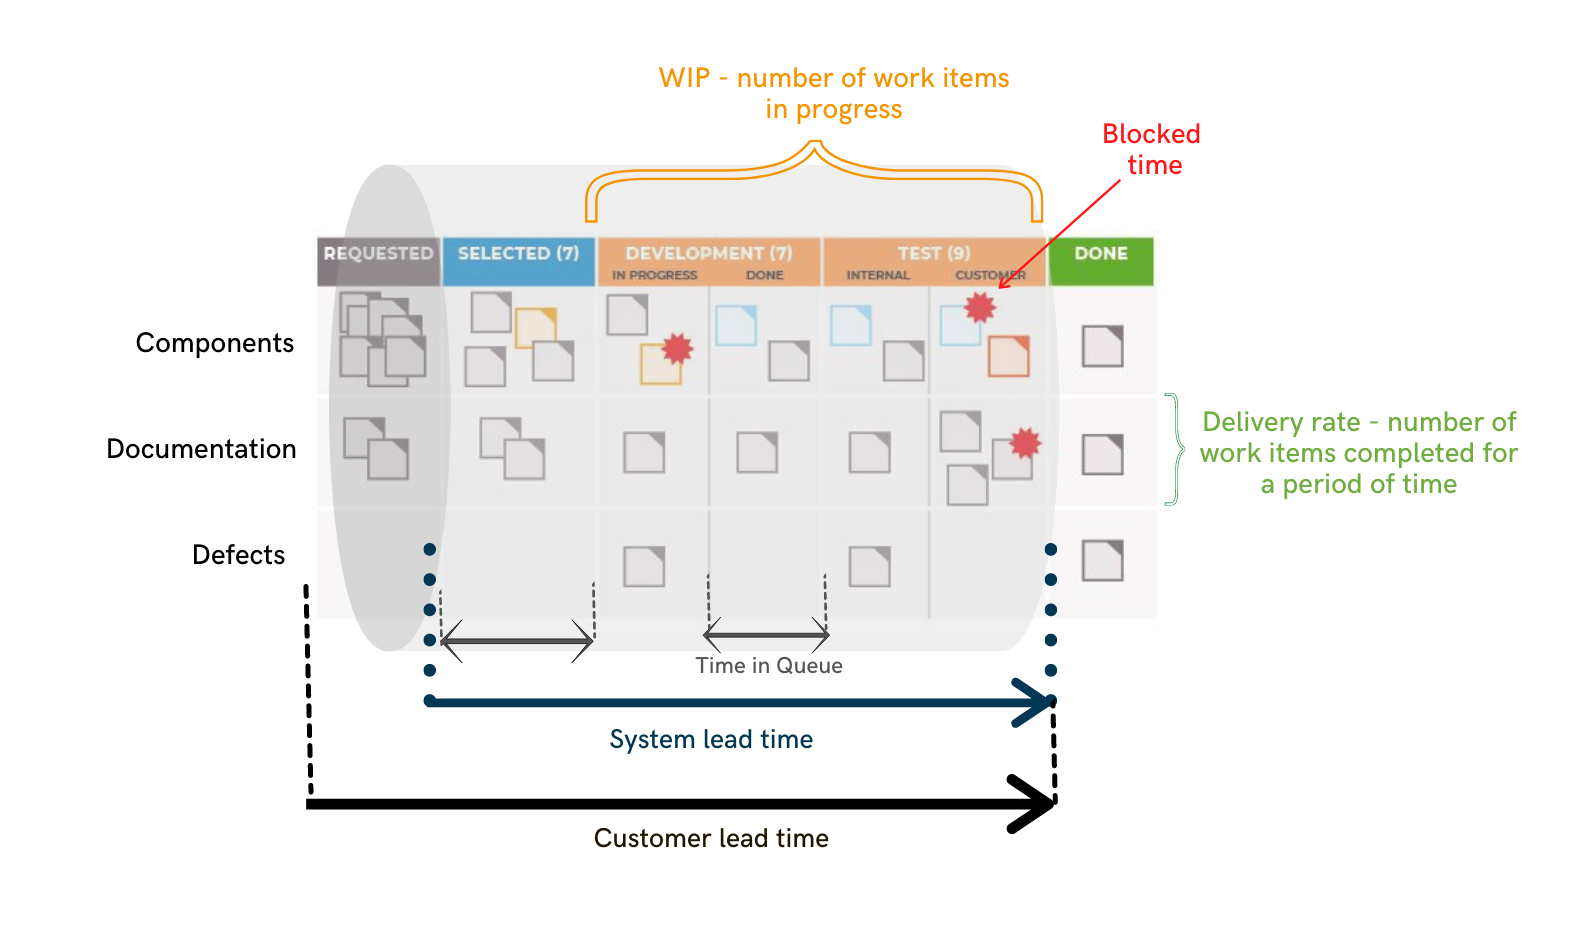
The following image visualizes the different flow-related metrics:
System lead time –the time that from the moment you start working on a work item until the moment it is delivered to its customer. This time includes the waiting time.
Customer lead time – the time from the moment when the customer has placed the work order until the moment when they receive it.
Blockage time – the time that the work item is stopped by some impediment in the workflow.
Take notes of the blockage causes, so that you can analyze them and understand their impact on the project and service execution times. This will help you define effective actions to reduce delays.
Queueing time – the time the work item is waiting for a person at the next step in the process to be able to do it.
The most effective way to take this metric is by configuring your tool so that it collects the data automatically.
Delivery rate (Performance; Throughput) – the number of work items completed for a period of time. Measure the delivery rate by type of work so that you can analyze your delivery capacity.
Work in Progress (WIP) – the number of work items in process.
Following the example of traffic, the WIP corresponds to the number of vehicles (motorcycles, cars, trucks and extra long vehicles) on the road.
The WIP strongly conditions the execution time of projects and services. Therefore, it is key to control it. However, this is perhaps the most difficult practice for the organizations.
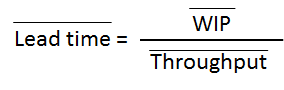
The Little’s Law describes the relationships between Lead Time, Work in Process, and Delivery Rate.
Nowadays, companies are looking for greater predictability and short delivery times for their products and services. Flow-related metrics are your means to identify causes for delays and define relevant actions. Use them.
What to do if you still have to give a specific date or delivery time? – Understand the range of variability of your delivery time and respond by evaluating the risk of not meeting the given deadline.
We will talk about this in another blog post.
Teodora Bozheva Accredited Kanban Trainer & Consultant
Co-author of the Kanban Maturity Model
www.berriprocess.com
Esta web utiliza cookies propias y de terceros para su correcto funcionamiento y para fines analíticos. Contiene enlaces a sitios web de terceros con políticas de privacidad ajenas que podrás aceptar o no cuando accedas a ellos. Al hacer clic en el botón Aceptar, acepta el uso de estas tecnologías y el procesamiento de tus datos para estos propósitos.
Más información